Chapter 8: Better assessment
8.1 You don't need maths
In Chapter 7b I explained the problems with the pseudo-mathematical approach to assessing the risk. If you are still under the illusion that there is some sort of general regulatory requirement for a risk matrix these words from HSG 65, the HSE’s key document on ‘Managing for health and safety’ make it clear:
For small businesses, with few or simple risks, a suitable and sufficient risk assessment can be a very straightforward process based on informed judgement and using appropriate guidance.
Unless your workplace is covered by specific legislations, such as COMAH (Control of Major Accident Hazards Regulations) or Offshore Installations (Safety Case) Regulations, nothing in the general legislation or guidance requires you to use maths.
Although there was previously a sample risk matrix on the HSE website, at the time of writing there is no longer a matrix for risk assessment. The example HSE risk assessment template does not include any columns for scoring, asking instead about what you are doing already, what else you need to do, who is going to do it and by when. The suggestions in the following sections all accord with that approach.
Box: How to read this book from here
For small businesses with straightforward operations you can read this chapter, skip chapters 9 and 10, and move directly to chapter 11. Spend less time assessing (step 2), and more time controlling risk (step 3). Within this chapter Sections 8.2 to 8.4 cover examples where you might need numbers, but those numbers won’t be drawn from a matrix, and the rest of the chapter looks at how to prioritise without using numbers.
If you work for an organisation that insists on a matrix, use chapters 9 and 10 make suggestions as to how you can use a matrix to better effect. If your organisation won’t let you adjust the matrix you have, you might start with chapter 10. Use the tests in that section to make the business case for changing the matrix. Or, use the tests to demonstrate to yourself that actually, in your case, you have a matrix that works (in which case, please contact me with the details).

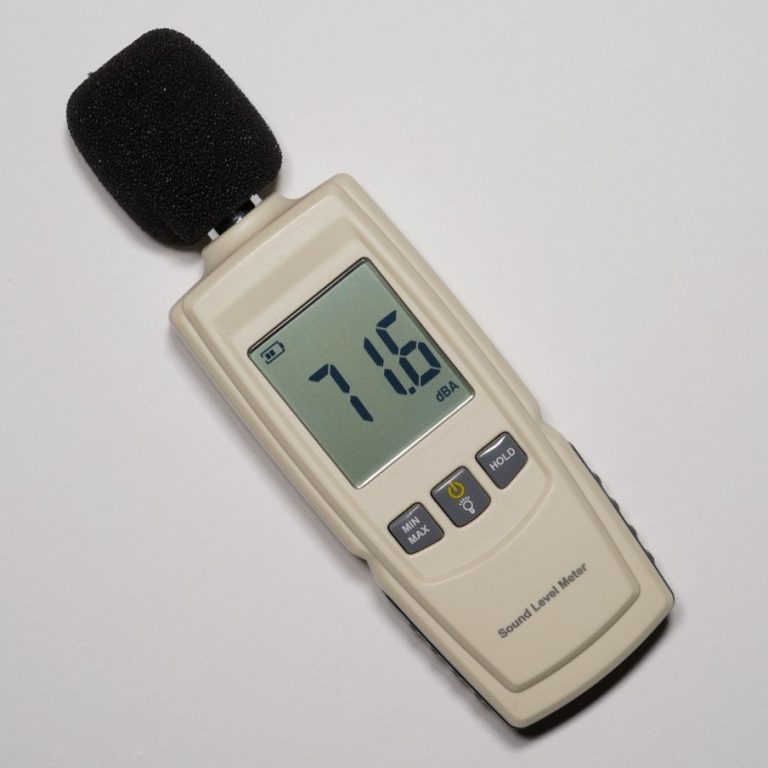
Decibels can be measured
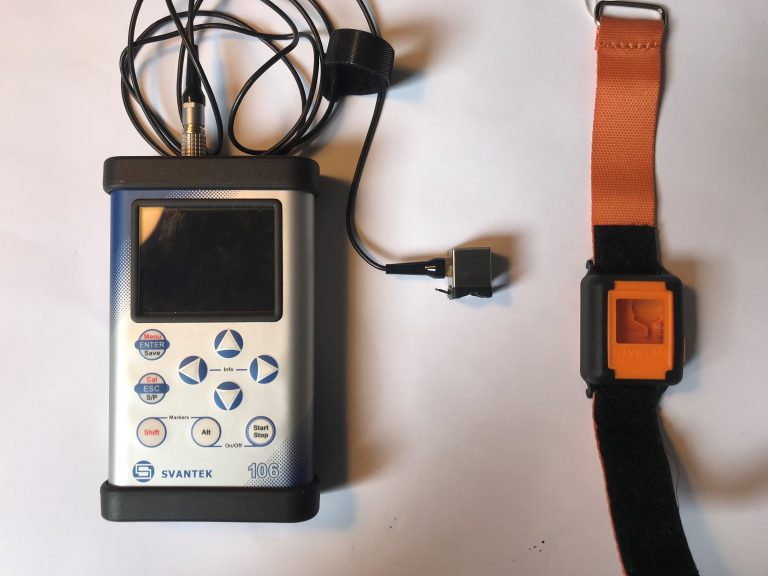
Vibration can be measured (illustration from HAVi)
8.2 Measure only what can be measured
Sometimes, it is useful to add numbers to a hazard. But only when there is something measurable.
If you might have a noise problem in your workplace you might arrange to have the noise measured in multiple locations at various times of the day. You can then compare the volumes recorded with the limits set by legislation. If any areas have noise levels above 80 dB, you need to find out how long people spend in each area to establish how close to limits for personal exposure people are. If you discover that given the time spent in the areas, and the hearing protection worn, everyone’s exposure is below the lower exposure action value (LEAV), that is not the end of the journey. You are still obliged to see if you can reduce the risk further, so far as is reasonably practicable, by applying further controls, such as replacing noisy machinery with quieter versions.
You can use a similar process for vibration – measure the vibration from your tools and compare the numbers with the statutory exposure levels. If full-time use of a tool can exceed those levels, you need to find out how much time people are spending using the tools. And then control the risk. Buy better tools, change work methods to reduce time spent on tools, and so on.
The HSE have downloadable spreadsheets which make it easier to calculate exposure to vibration and noise from collected data.
Like noise and vibration, radiation can be measured by experts with the right equipment. If people could be exposed to ionising radiation, there might be a requirement for them to wear personal dose monitors or for equipment to be assessed periodically for leakage (see L121, the approved code of practice and guidance for work with ionising radiation). Electromagnetic Fields (EMF) might need to be measured if your workplace includes significant sources such as MRI scanners, radio transmitters and some welding operations (see HSG 281, a guide to the Control of Electromagnetic Fields at Work Regulations). Radon might need to be measured if you have a workplace in a high-risk part of the country, particularly if you have a basement or other underground worksite.
Some hazardous substances have numeric values against which you can compare measurements. The HSE publication EH40 lists over 500 workplace exposure limits (WELs) measured in ppm (parts per million) or mg/m3 (milligrams per cubic meter). These are averaged over 8 hours (long-term WEL) and over 15 minutes (short-term). As with noise and vibration, you still have a duty to reduce risk so far as is reasonably practicable.
Some exposure levels might need be measured through health surveillance. Demolition and recycling jobs can expose people to lead dusts, fumes and vapours, for example when burning lead paint off a surface, or recycling lead-acid batteries. If, despite all reasonably practicable controls, someone might be exposed to lead, employers have a duty to provide health surveillance, including a measurement of lead in the body through a blood or urine test. See L132, the approved code of practice and guidance for the Control of Lead at Work Regulations, for more details.
8.3 Proxy measures
Sometimes there are things you can measure which are not a precise measure of the risk itself, but are nevertheless objective, and give you a good indication of how well risk is being managed. A common example of this is the management of legionella. As the HSE approved code and practice and guidance for the control of legionella bacteria in water systems (L8) explains, legionella bacteria grow most quickly in moist conditions between 20 °C and 45 °C. Therefore, keeping a record of the temperature of water (at sentinel taps, and in storage tanks) at appropriate intervals gives you an indication of when the risk has increased. For example, if the temperature in the hot water system drops below 50 °C, you might need to take remedial measures, such as pasteurising the water (see HSG 274 part 2).
Another measurement included in some written schemes for legionella control is to have samples of water analysed for ‘TVC’ – the total viable count, or the number of culturable bacteria in a volume of water. Although the bacteria might not all be legionella, the TVC is another useful and objective measurement to indicate risk in higher risk environments.

Water temperature can be measured
8.4 Expert scores
An FAQ on the HSE website in 2018 (now removed) used to explain:
Using a matrix can be helpful to control a risk. It is suitable .. to more complex situations. However, it does require expertise and experience to judge the likelihood of harm accurately. Getting this wrong could result in applying unnecessary control measures or failing to take important ones.
For some very specific hazards, the criteria for putting numbers on the factors that impact risk are clearly laid out, tried and tested. Here are two examples.
8.4.1 The example of asbestos
If you are responsible for any workplaces containing asbestos, you should have an asbestos survey where “expertise and experience” has been used to apply two scores for each incidence of asbestos:
Material assessment score – based on the asbestos and product type, the extent of damage and any surface treatment of the material. The score can be between 2 and 12.
Priority assessment score – based on the location of the asbestos, and how activities in that area could impact the asbestos. This should have been assessed in consultation with users of the location, not by an external consultant alone. The score can be between 0 and 12.
HSG 264, the HSE survey guide on asbestos, explains these scores in more detail. Following HSG 264, two experts are more likely to get the same scores for the same location.
These numbers should not be added or multiplied together. A material assessment score above 10 indicates a higher potential to release fibres if disturbed, but if the likelihood of being disturbed is extremely low (that is, the priority assessment is very low) then it might be better to spend resources on removing or remediating asbestos with a moderate material score that has a high priority score (for example, because the asbestos is in a school classroom). You need to see the scores separately to determine the results.
8.4.2 The example of hazardous substances
The HSE guide COSHH essentials: Controlling exposure to chemicals – a simple control banding approach explains how to identify the control approach needed from factors such as the Hazard statements (H) from the safety data sheet, the concentration used and the physical properties (dustiness or volatility). The system is necessarily more complex than guessing on a scale of 1 to 5 how hazardous something is or how likely it is to harm someone. But as a result, it provides more specific recommendations on how to limit harm from the substance, pointing towards specific HSE control guidance sheets. Because there is a clear approach to applying classification rules, two experts should come up with the same control recommendations for the same substance used in the same way.
Box: Don’t lose the detail
Don’t try and convert any of the numbers mentioned here back into scores on your risk matrix. Keep records of the decibels or meters per second squared or ppm or degrees Celsius or whatever other measure you used. It can be useful to include measures of time as well – so how long during the day was the factory operating at that volume, on how many days was there a cold tap recording temperatures above 20 °C, and how many people had to be taken off a job because their exposure to a hazard was uncomfortably close to a pre-determined limit? But unless you have a really good reason, don’t try and rank ratio numbers, or even expert judgements, into ordinal risk matrix numbers.
8.5 Priorities suggest you plan to leave some hazards unfixed
Asbestos has numbers because in most cases duty holders are not planning to remove all the asbestos in a location. The material assessment and priority assessment scores enable duty holders to decide which asbestos to remove, which to remediate, which to inspect more frequently, and which to leave alone. The separate scores help duty holders to consider other, inexpensive controls. If there is some asbestos in the back of a cupboard with a high material and a high priority score, instead of removing or remediating the asbestos to reduce the material score, you could reduce the priority score by sealing the cupboard shut and storing things elsewhere.
I had one client who ignored the material score provided by their asbestos specialist, and didn’t spend time finessing the priority score. Were they failing in their duty? No, because the duty holder had decided that all remedial work recommended by the specialist would be carried out. Since they were going to fix all the hazards, they didn’t need to prioritise them. If there had been any immediate danger to people, that would be prioritised, but the building had been managed well, and there were no such situations.
Applying this to your risk assessments, the only reason for a detailed analysis of likelihood and severity is if you are planning to leave some hazards uncontrolled. If there are hazards you don’t need to control, you probably should have left them in chapter 1. If you need to control a list of hazards, but only have the resources to do some this month, and some next month, the detail will help you decide on administrative measures for the short-term. If some areas are too noisy, can you reduce how much time people spend there (eg by job rotation) until you can make the area quieter? A colleague in retail gave me this example:
There are two holes – one in the customer car park, and one in the staff car park. You only have the resources to fix one this week, and one next week. Staff can be asked to apply temporary rules – a one-way system, a lower speed limit, a route that avoids the hole. Customers are less likely to comply, so you fix the customer car park first. You could argue you would get the same result with a matrix – more customers equals more harm equals a higher score. But the same argument might apply to a business where there are more staff vehicles per day than customer vehicles.
The pre-2019 HSE FAQ on risk assessment gave some good, brief, advice in response to a question about how to prioritise hazards:
In thinking through your priorities, think about the biggest or most serious risks first.
The next section will help you to assess these risks, without using numbers.
8.6 How to assess risk without numbers
From step 1 you should have:
The scope: a clear idea of what is being risk assessed, the people, locations, equipment, substances and so on involved.
The hazards: a list of well-defined hazards. These will relate to the people, locations and so on in the scope.
Rather than trying to weigh up at this stage how effective current, proposed, hypothetical or imagined controls are, let’s focus on what could go wrong. On ‘who might be harmed and how.’ Can you produce a statement (not a number) that explains the most-likely worst-case scenario?
That phrase needs unpacking. We’re trying to assess the severity of the consequences here, and yet I’ve brought in a probability phrase “most-likely”. Here’s an example to explain.
Ask yourself:
Imagine someone falls from the window of a two-storey building. Write down at least five different outcomes of the fall. Now arrange them in order of consequence. Now, think which one is the most likely.
This person could be immensely lucky and escape with no injury, or just bruising. In freak scenario they could fall on a party of infant school children and killed themselves and ten small infants. The most-likely worst-case scenario is that they suffer a major injury, with broken bones, and possible long-term effects such as paralysis. If you like statistics, you could see this as a bar chart. Imagine we had data for 1000 falls from 1st floor windows. We place the consequences of the falls along the x axis, from nothing happened, to an accident causing multiple deaths. It might look like Figure 8.1.
From this, you can see that the most-likely worst-case scenario is major injury to a single person (the person who falls). The single death, although not the most frequent accident, is also worth noting. So I could produce a statement to describe “Who might be harmed and how”:
Assessment of harm:
If a patient falls from the first-floor window they could suffer major injuries such as broken bones, leading to long-term injuries, paralysis and in some cases, death.
Too many risk assessments leave out this stage.

Figure 8.1 Hypothetical bar chart for the consequence of falling from a window
In the driving for work example I used in Chapter 7 the safety professionals came up with inconsistent numbers which provided little support in determining controls. We could instead have produced four statements assessing harm:
- If a driver is involved in a motorway accident there could be multiple fatalities, including the death of our employee.
- If a driver is shunted by another vehicle, or shunts another vehicle, they could suffer whiplash.
- If our drivers spend long hours driving without a rest they can suffer from musculoskeletal pain which might lead to time off work.
- If a car hit a pedestrian, the pedestrian could be seriously injured or killed. Our employee suffer from whiplash, and psychological harm.


It would be useful if these statements are based on data, but even if they are based on experience and hearsay, at least by writing them out like this, the rationale for decisions can be discussed and debated. This is a far more useful assessment of risk than a set of numbers. You’ve outlined who could be harmed, and how, and given an indication of the severity of that harm. You’ve also provided the information that will be needed when you move onto Step 3, Control the risks.
Ask yourself:
Consider a typical hazard in your workplace. Where might you find it? Would the severity vary depending on the location? Write down at least three statements of harm. If you can’t think of a hazard, consider ‘slipping on a wet surface’.
Is it possible to decide which statement describes the most likely event? Is it possible to think about which is the worst consequence?
Does it inspire more ideas about possible controls than putting a three-word description (like ‘slips and trips’) in the hazard column and numbers from 1 to 25 in the scoring columns? See the appendix for some suggested harm statements.
8.7 Uncertainty
In Chapter 7 I raised the difficulty of representing uncertainty in a risk matrix. Figure 7.3 showed one way of representing different estimates for the risk score for hazards. The approach of writing harm statements helps us to deal with this uncertainty. You can write multiple statements as we did for the examples in section 8.6, or include alternative options within a single statement. This is also helpful where the impact of something could be negative or positive (something you can’t show on a risk matrix).
For example, imagine you are about to introduce a new shift pattern which you hope will improve wellbeing and productivity for staff. Correctly, you have decided that you need to assess the risk of this new way of working. Your harm statement should admit to this uncertainty, for example stating:
The results of this pattern of working could be improved wellbeing and reduced errors, but there is also a danger that for some people it will reduce wellbeing and increase short-term sickness absences.
8.8 Conclusion
If there is an objective way of measuring a hazard (like noise in decibels) then if it is useful to measure it, do so. If there is an expert scheme for assessing components of a hazard, like the priority and material assessments for asbestos, then use those (but don’t average, sum or combine them). If there isn’t an agreed way of measuring or ranking a hazard, instead agree clear statements of the most-likely worst-case scenarios, and then move on to focus on the controls.
If you’re happy with this as an approach, I’m going to suggest something you won’t find in many books. Ignore the next two chapters. They are for people who really like matrices (or work for organisations that insist in them). Once you’ve got your scope, your hazards, and your assessment of harm statements clear, read Chapter 11 to focus on controls.
However, if you still think a matrix is a good idea (or you need to understand the arguments to convince others) then read Chapter 9 and Chapter 10.
You can use the Contact form to send me feedback. If you’d like to receive an email when I add or update a chapter, please subscribe to my ‘book club’
Alternatively, you can go back to the book contents page.
Note: Chapter 11 is work in progress. If you’re ready to read it, please send me an email or use the contact form to nudge me!