Chapter 7: Assess the risk (part 2)
See the first half of chapter 7 for the theory of assessment.
7.2 Why assessment doesn’t work in practice?
7.2.1 We don’t have the data we need for OHS
For coins and dice we know how many possible outcomes there are, and it is easy to calculate the probability of any given outcome. For OHS we don’t have the data. Sometimes we don’t even know how many times someone does a task, let alone how likely they are to make a mistake. It’s like seeing a six on the upper side of a dice, but not knowing how many sides it has.
If we don’t have the data for a proper QRA, is there any benefit in using a risk matrix? The defence that the matrix is a way of prioritising hazards has many flaws, including:
- Without a system model, assessors, managers and workers have different, unspoken, understandings of what each hazard is. Hence, people will suggest different numbers, all of which they can defend.
- We don’t agree with what ‘unlikely’ or other terms mean, so even for a well-described hazard, we would give different scores.
- Risk matrices don’t represent how certain (or uncertain) we are.
- Multiplying ordinal numbers (like shoe sizes) makes no sense, and loses valuable information needed to decide on the best controls.
And most critically, as a result of the above flaws:
- The matrix can lead us to prioritise the wrong things, because it implies that hazards with the same risk score should be treated the same way, and those with higher scores given more priority.
7.2.2 Even experts will suggest different numbers
I sat in a room with two experienced safety professionals. Let’s call them Randle and Hopkirk. A list of hazards for a job role had been identified, and we had to agree on the risk rating (based on the company-mandated 5×5 grid). The first hazard was ‘driving for work’. What was the likelihood? What was the consequence? We wrote down our rankings without consultation, and then shared our results.
Ask yourself:
Each person explained their evaluation:
Randle says it’s 1 x 5 = 5. ‘If there was a major pile-up, the consequence could be multiple fatalities (severity = 5). But that’s never happened in the fleet so far, so I’ve given it the lowest likelihood (likelihood = 1).’
Hopkirk says it’s 3 x 3 = 9. ‘I’ve gone for a more common accident. The likelihood of a shunt in traffic is medium (3), and the consequences are likely to be whiplash, so again medium (3).’
I suggested 4 x 2 = 8. ‘The most likely outcome from the hours of driving they do is musculoskeletal pain. That’s quite likely (4) given the sedentary nature of the job. The consequences are more than a bruise, but still quite low as the symptoms only impact one person each time (2).’
Our judgements were reasonable, but with different outcomes in mind, we had different judgements and would suggest different controls.
Randle might suggest planning routes away from major roads; Hopkirk might suggest vehicle technology that maintains distance from other vehicles; I might suggest more frequent breaks and training on how to adjust car seats.
To be useful, the assessment needed to look at all these outcomes and compare all the current controls with best practice. But we didn’t need risk scores to decide that.


7.2.3 We don’t agree what ‘unlikely’ (or any other term) means
I didn’t show you a 5×5 matrix for the previous example, I just suggested a scale from 1 to 5. You might argue that using qualitative probability terms like ‘remote’ and ‘unlikely’ would reduce the ambiguity. We could have agreed the probability and severity for every scenario suggested, based on definitions of each number on the scale.
However, research for the Intergovernmental Panel on Climate Change (IPCC) in 2009 suggests that using probability descriptors creates only ‘an illusion of communication.’ Researchers asked subjects to assign frequency ranges to qualitative terms used in sentences such as, ‘It is very likely that hot extremes, heat waves, and heavy precipitation events will continue to become more frequent’. Estimates for ‘very likely’ ranged from 60% to 95%. Estimates for ‘very unlikely’ were even wider – from below 5% to above 80%. More than 75% of subject estimates for these terms were outside the ranges defined by the IPCC experts.
Specialist staff are no better. 105 consultants, medical staff and students at the Royal London Hospital were asked to assign probabilities to words used to describe the risk of adverse outcomes after surgery. Even when extreme answers were excluded, the central range of answers for many terms overlapped as shown in Table 7.3.
| Term | Mean | Central 50% of answers |
|---|---|---|
| Almost never | 4% | 0-3% |
| Very rarely | 5% | 1-3% |
| Rarely | 6% | 1-5% |
| Improbable | 8% | 1-10% |
| Unlikely | 13% | 5-20% |
| Possible | 32% | 15-50% |
| Probable | 64% | 50-80% |
| Likely | 68% | 60-80% |
| Very likely | 81% | 76-90% |
In this study, the percentages were about the probability of different outcomes per treatment, so it was clear what the unit was. One of my former clients attached percentages to their risk matrix, but when I asked, no one could explain if it was per time the task is done, per year, per million work hours, per worker lifetime or some other metric. The percentages meant no more than the vague terms they were used to define.
If you think 3% is a good answer for ‘very rarely’ or ‘almost never’ try this next exercise:
Ask yourself:
What it would mean to have a 3% chance of a ladder accident every time someone climbed a ladder? How many times could people climb a ladder in an organisation before the chance of an accident was more than 50%? How many times before the chance was over 99%?
See the appendix for the answer. Was it what you expected? Would you call 3% ‘rare’ now?
As a further barrier, our brains are very bad at separating out probability from severity. As a result, we give different probabilities to the same qualitative probability term depending on the severity. For example, in one study students assigned an average probability of 8.8% to the term ‘rarely’ when told a treatment would rarely cause a dry mouth. This dropped to 2.3% when a more severe outcome, impaired vision, was described. The same research review reports on a study with patients who thought that ‘rare’ deaths would occur less often than ‘rare’ cases of pneumonia.
Although the studies on the use of qualitative terms cited here have been outside OHS, the results undermine the myth that there is any agreed understanding of ‘probable’ or any other terms you might see on a risk matrix. The authors of the Royal London Hospital study suggest that what patients really want to know is that surgeons have done everything in their power to reduce or minimise any negative effects ‘albeit without guarantee that every risk can be eliminated.’ This is equally relevant to OSH, and the reason we should focus on reducing risk over trying to measure it.
7.2.4 Dealing with uncertainty
We’ve seen how our estimation of what a probability term means is conflated by how severe we imagine the outcome. It is also influenced by certainty and confidence.
Imagine an intelligent robot that watches your workplace, and counts how often events occur. If the robot saw three red balls and one blue ball coming off a production line, it might make a working assumption that 25% of balls would be blue, but with a low confidence level as this has occurred only once. Seeing six red balls and two blue balls would reinforce the assumption, giving a higher level of confidence. Seeing 600 red balls and 200 blue balls would further increase the confidence. But the estimate of the probability of a blue ball would be the same throughout – 25%. In a 2019 study when subjects were shown two blue and six red balls, most said that the next ball was ‘probably’ going to be red. When shown one blue and three red balls, subjects were equally divided between ‘possibly’ and ‘probably’.
So a manager or OHS professional who has seen, for example, five ladder accidents in twenty years might apply a higher estimate of probability to this event than a less experienced colleague who has seen one ladder accident in four years. Our intelligent robot would assign the same probability in both cases, but it would understand that there were different levels of confidence associated with each judgement. The standard risk matrix provides no indication of how certain we are about our judgement.
Attempts have been made to represent levels of uncertainty within a risk matrix by using a box or circle across multiple values. See Duijm (2015) and Ale et al (2015) for more detail of this approach. Figure 7.3 shows one possible representation for just three activities:
Driving for work: this represents the four different scores (5×1, 2×4, 3×3, 4×2) mentioned in the scenario in 7.2.2 and in 7.2.3.
DSE (display screen, or computer screen) use: Worst outcome is likely to be musculoskeletal aches and pains, or possible eye strain, but let’s assume we don’t know how well this is managed, so it could be anything from very unlikely to very likely.
Walking on uneven floors: We probably know already that slips and trips are the most common cause of accident in the workplace, so this block bridges likely and very likely. The outcome of slips and trips can vary enormously, from embarrassment, through to a fatal head injury.
You could modify the shapes to represent more subtlety – perhaps the ‘walking on uneven floor’ would be very likely for the moderate and minor injuries, and just ‘likely’ for the extreme categories. But you can see that the diagram is already looking complicated in trying to represent three hazards. This might be a useful exercise if you are with a team disagreeing on how to rate a particular hazard, but the time might be better spent working out how to control the hazard.
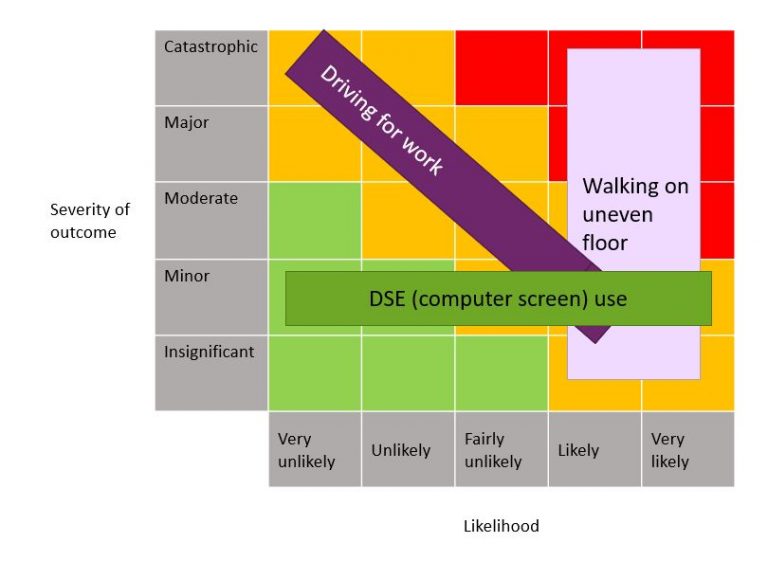
Figure 7.3: Representing uncertainty is possible, but would this representation make it any easier to prioritise controls?
7.2.5 When we multiply risk matrix scores, we lose information
To reduce the risk from the hazard we need more information than the risk score. We had it in our heads when we came up with the score, but we threw it away in coming up with a score. Think back to the earlier vehicle accident example:
- Randle scored a 5
- Hopkirk estimated a 9
- I suggested 8.
It sounds like Hopkirk and I were pretty close, and Randle was a long way behind. If we’re looking for a single ‘risk level’ do we average these scores, or go for the most pessimistic? Whatever we do, we’ve lost (or perhaps never captured) valuable information. Perhaps I find an old version of the risk assessment, and it also scored the risk as 8, so that backs up my position. But when questioned, while my 8 came from a moderately high likelihood (4) of a minor (2) but not insignificant injury, the original 8 assumed an unlikely but not remote chance (2) of a major but not catastrophic injury (4). A pedestrian had recently been knocked down by a vehicle, and this was on the risk assessor’s mind at the time.
When we assign a single figure for a hazard, we grossly oversimplify the situations people face, and reduce the likelihood that we will identify the necessary controls. Future chapters will give some examples of how to document the identified hazard, the range of anticipated outcomes, and what factors we know will influence those outcomes.

Box: Mathematical criticisms of risk matrices
If you want more mathematical accounts of what is wrong with risk matrices, see these two papers:
Cox, LA Jr (2008). What’s Wrong with Risk Matrices? Risk Analysis 28 (2), 497–512. Key quotes:
Typical risk matrices can … assign identical ratings to quantitatively very different risks
Risk matrices can mistakenly assign higher qualitative ratings to quantitatively smaller risks. For risks with negatively correlated frequencies and severities, they can be worse than useless, leading to worse-than-random decisions.
Thomas P, Bratvold RB & Bickel JE (2013). The Risk of Using Risk Matrices. Paper presented at the Society of Petroleum Engineers (SPE) Annual Technical Conference and Exhibition, New Orleans, Louisiana, USA, September 2013. Key quotes (referring to risk matrices as RM):
RMs produce arbitrary decisions and risk-management actions.
We are not aware of any published scientific studies demonstrating that RMs improve risk-management decisions. However, several studies indicate the opposite: that RMs are conceptually and fundamentally flawed.
7.2.6 The matrix can lead us to prioritise the wrong things
The justification given for using a risk matrix is that although the numbers aren’t mathematically based, they help us to rank hazards so that we can prioritise action. But we’ve seen that our judgement of probability is influenced by severity, by experience and by the language used.
As we saw with the driving example, a hazard assessed as 2×4 will need different handling to one assessed as 4×2. Several hazards might have the same 3×3 score, but require different priority. This is confirmed in one of the most useful bits of research the HSE ever commissioned on risk assessment, Good practice and pitfalls in risk assessment, RR151.
hazards of low severity and high likelihood will receive the same risk value as hazards with high severity and low likelihood. Although the risk values may be the same, the response to these different hazards in terms of priority for correction may be very different.
Applying the risk level calculated on a matrix can easily lead us to prioritise the wrong things.
Ask yourself:
You have carried out a risk assessment. You identified 20 hazards, and have scored them for likelihood and severity. The hazard with the highest ranked severity will take significant time and resource to reduce. Some of the lower ranked hazards can be fixed quickly, easily and cheaply. Which are you going to fix first?
Sometimes, hazards with lower scores need more immediate attention than those with higher scores.
We saw in chapter 6 that you must prioritise some control measures because they are required by law, regardless of your assessment of the risk (see Wallace v Glasgow City Council, 2010 for example). After this, can we really ignore all hazards in the green portion of the matrix? Some risk matrices label the green portion as ‘no further action required’ but SFAIRP means that this is not true. If you have assessed a likelihood of ‘1’ because certain controls are assumed to be place you must monitor those controls. Assuming that in step 1 all the things you identified are hazards, then whatever conclusion you come to when you assess risks, you have an ongoing responsibility to monitor and control these hazards. You can’t ignore additional cost-effective control measures because you assessed the hazard into the green part of the matrix. If there is an accident, assessing them away with a coloured grid will not provide a defence in court.
There are a lot more human issues around risk matrices I haven’t covered. For example, I know that managers will ‘game’ the numbers, either to make something look safe enough, or to make it look more dangerous to justify expenditure on equipment or people. The anchoring effect means that someone carrying out a risk assessment for office workers might assign the highest severity to a fall from a step ladder. The supervisor doing the risk assessment for facilities regards a stepladder fall as only a moderate severity, saving the higher scores for an exploding pressure vessel or electric shock. It would be wrong if the organisation gave more resources to reduce a score of 20 in the office than to reduce a score of 16 in the facilities team without comparing the scenarios. There are further social, ethical and cultural factors that will influence how people ‘score’ a hazard using a risk matrix.
7.3 Conclusion
It is perhaps unfortunate that we call the overall process ‘risk assessment’ and then spend so much time on the assess/ evaluate step. As we considered in Chapters 1 to 4, more effort is needed to make sure we have identified and described hazards which are significant to any of the people who could be exposed. When we get to chapters 11 onwards, we’ll focus on the part of the process that makes life safer – on controlling the risk, and on monitoring those controls. But beyond the identification of the hazards, some form of assessment or evaluation is necessary, before, during and after considering how much effort is needed to control the risk. The next few chapters will consider some alternative ways of assessing (or evaluating) the risk.
Chapter 8: Assessment without a matrix – it might be that after you’ve read that, you can ignore the next two chapters.
Chapter 9: Assessment with a better matrix (if you insist!)
Chapter 10: Assesment – test your matrix
You can use the Contact form to send me feedback. If you’d like to receive an email when I add or update a chapter, please subscribe to my ‘book club’
Alternatively, you can go back to the book contents page.