Chapter 7: Assess (or evaluate?) the risk
7.1 Here's the theory
Although, as previously explained, assessment and control are iterative, it is convenient in a book to describe and discuss them in separate chapters. Here then is the theory behind assessment (and evaluation – see box) within the context of risk management.

Assess or evaluate?
Most of the time we use ‘assess’ and ‘evaluate’ as synonyms. But educationalists sometimes use the terms to mean different things. For example, assessment can refer to how someone is tested during their learning journey, to identify further learning options to help them succeed. The evaluation is the end of the process – did they pass or fail? With this usage ‘assess’ is part of an iterative process, while ‘evaluate’ is a one-off. Your driving instructor assesses your driving to decide what you need to practise; the examiner evaluates your driving to pass or fail.
The HSE had used ‘evaluate the risks’ since 1998. In changing to ‘assess’ in 2019 were the HSE trying to make the point that this wasn’t a pass/ fail process? Was the intention to emphasise that assessment is part of how to decide what controls are needed?
I could be reading too much into this (I’d be interested to hear from the HSE if there was a reason). It might just have been a decision to use a shorter, more familiar synonym. It does lead to a circular referencing problem, in that ‘assess the risk’ is now a step within ‘risk assessment’.
In this chapter, I will use ‘assess’ as the default, unless quoting from another source. Please contact me if you’ve a sound basis (or just an idea) for challenging that default.
7.1.1 Evolution of 'assess the risk'
| Version | Step heading | Step description | Risk definition |
|---|---|---|---|
| 1998 | Evaluate the risks and decide whether the existing precautions are adequate or whether more should be done. | Consider how likely it is that each hazard could cause harm. .. after all precautions have been taken .. decide for each significant hazard whether this remaining risk is high, medium or low. | Risk is the chance, high or low, that somebody will be harmed by the hazard. |
| 2006, 2011 | Evaluate the risks and decide on precautions. | Having spotted the hazards … The law requires you to do everything ‘reasonably practicable’ to protect people from harm … the easiest way is to compare what you are doing with good practice. | Risk is the chance, high or low, that somebody could be harmed by these … together with an indication of how serious the harm could be. |
| 2014 | Evaluate the risks. | Having identified the hazards … decide how likely it is that harm will occur … do everything ‘reasonably practicable’ to protect people … balancing the level of risk against the measures needed to control the real risk in terms of money, time or trouble … you do not need to take action if it would be grossly disproportionate to the level of risk … you are not expected to anticipate unforeseeable risks. | … how likely it is that harm will occur, ie the level of risk |
| 2019 | Assess the risks. | Once you have identified the hazards, decide how likely it is that someone could be harmed and how serious it could be. This is assessing the level of risk. | How likely it is that someone could be harmed and how serious it could be. This is assessing the level of risk. |
Table 7.1: Changes to the HSE evaluate / assess step
The original 1998 version asks for consideration of likelihood, and suggests a simple scaling of the outcome of the risk evaluation (high, medium, low). The 2006 and 2011 versions focussed on describing how to apply precautions. That risk was a combination of chance and ‘how serious the harm could be’ was not mentioned within the evaluate step, but given as a background definition for understanding the document. The emphasis was strongly on control. Strange then that the 2014 version dropped mention of precautions from the step title, and dropped severity from the definition of risk. The 2014 re-write emphasised the concepts of ‘foreseeable’ hazards and ‘reasonable practicable’ controls. The 2019 (online only) version re-introduced severity alongside likelihood.
7.1.2 Assessment theory
With the emphasis on the 2019 version of the HSE description of the risk assessment, but with a view on the historical development described above, the HSE theoretical process for assessing the risk is:
- For each hazard identified, and given what you’re already doing to control the risk, decide how likely it is that someone could be harmed (by that hazard).
- If the harm occurred, decide how serious it would be.
- Use these two measures to decide whether to spend more time, money or trouble on reducing either the likelihood, or the severity of harm (or both).
You do not have to remove all risk, but you must reduce risk SFAIRP (or do everything ‘reasonably practicable’ to protect people). But if you’re going to use the RP scales, doesn’t that mean you need to measure the risk on one scale, and the sacrifice (time, money, trouble) on the other?
This is the reason people give for applying a risk matrix. For example, they assess likelihood on a scale of 1 to 3, and severity on a scale of 1 to 3, then multiple the two numbers together to get a score for ‘risk’ from 1 to 9 (where 3×3 is the highest risk, and 1×1 is the lowest).
The HSE have never suggested in any version of INDG 163 that you should create or adopt such a risk matrix. It’s possible the idea came from (or was reflected in) early versions of HSG 65, ‘Successful health and safety management’. HSG 65 (1997) suggested two separate scales as shown in Table 7.2
| Likely effect of a hazard | Likelihood of harm |
|---|---|
| Major – Death or major injury (as defined in RIDDOR) or illness causing long-term disability. | High – Where it is certain or near certain that harm will occur. |
| Serious – Injuries or illness causing short-term disability. | Medium – Where harm will often occur. |
| Slight – All other injuries or illness. | Low – Where harm will seldom occur. |
Table 7.2: HSG65 scales for risk assessment
HSG 65 (1997) follows up these scales with the formula that has for over two decades reinforced the idea that these ordinal, ranking assessments can be treated as mathematical numbers:
In this case risk can be defined as the combination of the severity of harm with the likelihood of its occurrence, or:
Risk = Severity of harm X Likelihood of occurrence
In an FAQ on the HSE website until at least 2020, the HSE stated:
Most businesses will not need to use risk matrices.
In adding that some organisations might find it helpful to use a matrix ‘for prioritising your actions’, the HSE proposed a 3×3 matrix, similar to the one in Figure 7.1 (although I’ve turned it around, to place the 0,0 origin in the bottom left-hand corner). They applied the maths of the 1997 version of HSG 65 to produce scores, and equate these to conclusions as shown.
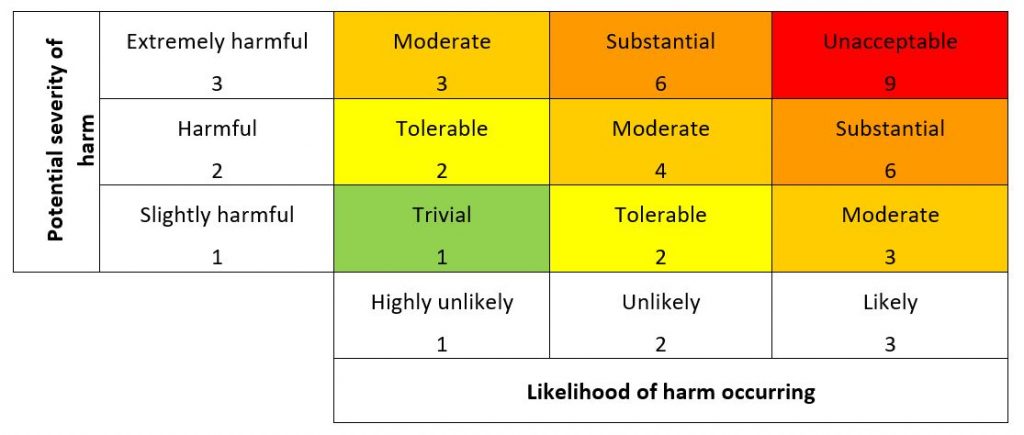
Figure 7.1: Risk matrix using values and labels from HSE 2019
It’s possible that the aim of the HSE in INDG 163, HSG 65 and in the FAQ might have been to encourage employers to keep risk assessment simple – to focus on good practice controls over analysis. However, the result of providing a scale, a formula and a grid was the proliferation of this as “the standard technique” for risk assessment.
Not content with the 3×3 matrix, many well known health and safety courses use a 5×5 matrix, encouraging people to take this into the workplace and make it part of their organisations’ health and safety management systems.
7.1.3 Quantitative or Quantified risk assessment
Figure 7.1 is a risk assessment matrix with numbers to help with ranking or prioritising hazards. Using this matrix will not produce a quantitative, quantified or even semi-quantitative risk assessment. If you already understand this, you will find this section a gross oversimplification, and can skip to the next section.
A quantitative risk assessment requires:
- a model of how harm could occur from the hazard,
- information about the probability of steps leading up to (and possibly after) an event, including the likely success or failure of barriers,
- a means of quantifying outcomes on the same scale.
Event trees and fault trees are often used to provide the model, and probabilities assigned to each node or decision point on the model, and a cost (number of lives, monetary value) on each possible outcome. We’ll use a simple example to explain this.
Ask yourself:
You are going to toss a coin three times. Assuming it is a fair coin (that is, equally likely to be heads as tails) how likely are you to get no heads? Now imagine that each head is an outcome associated with an injury. How likely are you to get no injuries?
Figure 7.2 shows that there are 8 possible outcomes from tossing a coin three times (2x2x2). If we are not interested in the order of the heads and tails, we can see that 2 heads and 1 tail occurs three times, while 1 head and 2 tails also occurs 3 times. 3 heads and 3 tails occur just once each. So the probability of having no heads is 1 in every eight coin throws. This could be expressed in three ways:
- as a fraction, 1/8
- as a percentage, 12.5%
- as a decimal number, 0.125
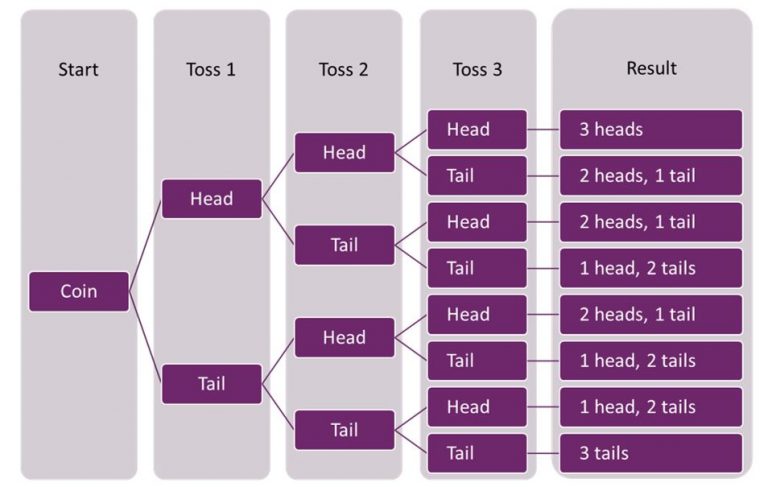
Figure 7.2: Outcomes from tossing a coin
To achieve this result, we needed a model (what happens every time a coin is tossed), we needed information about the probability of each outcome (on each throw, we were 50% likely to get a head, 50% likely to get a tail) and we needed to know how many times the coin would be tossed. We’d also need a way of weighting or valuing each outcome, such as assigning a monetary loss each time to getting a head.
If you consider how complicated Figure 7.2 looks for tossing a coin 3 times, think about producing one for shaking a six-sided dice six times. Then imagine doing this for even a simple task in the workplace.
Figure 7.3 shows a fault tree for one injury outcome during a boiler maintenance task.
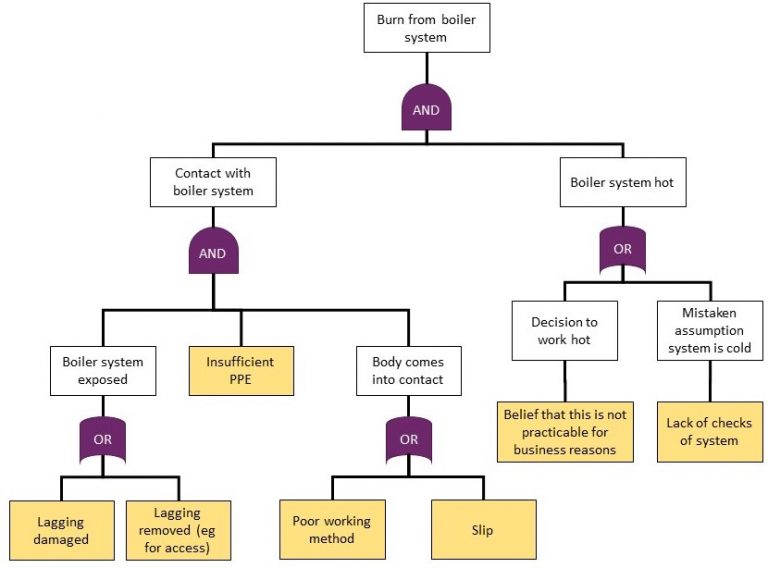
Figure 7.3: Fault tree for a burn from a boiler during maintenance
The FTA provides a model which identifies the data that I need. To get the data, you would need lots of observation, inspection and conversations. It’s likely there would be lots of simplification and generalisation – for example, would it be sufficient to assume that if they don’t wear PPE for 20% of observed tasks, that would apply to the specific task of boiler repair? How would I work out how likely someone was to make a slip with a tool? I could ask people about their beliefs on practicability, but I might need hours of observation to assess the probability of missing a check.
Once we had that data, we’d need to do the same for the other injury outcomes listed in the risk assessment, such as exposure to steam or electric shock.
And that would only give us the numbers for probability. We’d also need some way of measuring the harm done. If we had a matrix for financial risk, this might be straightforward. We could assess the typical cost of each outcome (£, $ or €), and use that in the QRA. If we were comparing large COMAH or nuclear sites, we might count how many people are exposed to risk within each probability contour. But for most OSH accidents, we’re talking about a range of injuries, from bruises and contusions, through breaks and amputations, to paralysis and death. How do we put those of a proper, quantitative scale? There are methods for doing this – see Box: How to value a life.
Box: How to value a life
The Anglo-Saxons were quite clear about the monetary value you could place on a life: compensation for a fatality was set at 200 shillings for a freeman, and 1200 shillings for a nobleman. These days, inflation aside, we are less comfortable with such a stark valuation. However, in some projects, a valuation is necessary. How do you allocate resources within a stretched national health service? How does the military make decisions about deployment of equipment and personnel?
One tool is called VPF – value of a prevented fatality. This is typically used to assess the value of expenditure on transport infrastructure, alongside the VPI – value of a prevented injury – for different severities of injury.
Another tool is the VOLY (value of a life year) which the National Institute for Health and Care Excellence (NICE) compare a standard with a QALY (quality-adjusted life year) to determine the value of any treatment. QALYs are age-related. A child injured or killed at age 10 has lost (statistically) at least 75 years of quality life; a 75-year-old with the same accident might only have lost 10 years. From an ethical point of view, would you be comfortable valuing older staff less than younger staff? In reality you might value the more experienced employee more.
I wrote a longer article on this, mentioned here. If you are interested enough to want to read the full, two-part article, please contact me.
With the time and resources, and the desire to overlook the ethics of potentially exposing different workers, customers or members of the public to risk depending on their age and sex, you could estimate the reduction in health of a bruise compared to an amputation in QALYs.
If you multiplied the QALY value by a precise value for likelihood you would have comparable numbers for each hazard. However, in most cases it is not possible to quantify either the likelihood or the severity with such accuracy, and hence the risk matrix attempts to categorise the risk into one a limited number of categories by making relative judgements (eg a broken leg is worse than a small cut) rather absolute judgements.
7.1.4 Ratio and Ordinal data
One last piece of theory that is useful to understand before we look at why the assess stage of risk assessment doesn’t work is the difference between ratio and ordinal data.
With a ratio scale, you know how the numbers relate to each other. If you have £28 and I have £14, I can say that you have £14 more than me and that you have twice as much as I have.
Shoe sizes are on an ordinal scale, which provides a rank order. Look at these two pairs of shoes. How much bigger is the large pair? The large pair is a size 12, and the smaller ones are a size 3, but the large ones are not four times the size of the small ones – they are just nine sizes bigger. Two size 6 shoes end-to-end don’t add up to a size 12. A size 7 and a size 3 end-to-end won’t be the same length as a size 6 and a size 4.
If you’ve had enough of shoes, take one last example. At school, Glenda always came first in races. Imagine there were three of us running. Glenda came first (of course); Gillian came second, and I came third. Glenda was faster than both of us, but the order tells you nothing about how much faster she was, or whether Gillian was almost as slow as me, or almost as fast as Glenda. For the record, my time for the 200m was about twice that of Glenda’s, but rank order won’t tell you that.

A size 12 shoe isn't 4 times the size of a size 3, and neither is a score of 12 4 times the risk as a score of 3.
7.2 What's wrong with the 'assess' step of risk assessment?
Read on for the second part of chapter 7, which explains what’s wrong with how we do the ‘assess’ or ‘evaluate’ step in risk assessment, or go straight to what to do instead in the following chapters:
Chapter 8: Assessment without a matrix
Chapter 9: Assessment with a better matrix (if you insist!)
Chapter 10: Assessment – test your matrix
You can use the Contact form to send me feedback. If you’d like to receive an email when I add or update a chapter, please subscribe to my ‘book club’
Alternatively, you can go back to the book contents page.