What is: Heinrich's accident triangle?
First published in Health and Safety at Work Magazine, August 2014
The accident triangle, asserting a fixed ratio between the worst accidents in a workplace and the smallest ones has come under sustained attack. Bridget Leathley asks whether it still has any value.
Since I wrote this article, Carsten Busch has carried out extensive research into Heinrich’s life, work and his data. I recommend his website Mind the Risk for more details.
An uncertain ratio?
The big, signposted change to the 2013 issue of the HSE’s management system guidance HSG65 was from POPIMAR (policy, organising, planning and implementing, measuring performance, audit and review) to PDCA (plan, do, check, act). A less trumpeted alteration was the loss of the text box Inset 1.
Did anybody notice? The 300 words of Inset 1 summarised the results of accident ratio studies, also known as accident triangles. It cited work by the HSE’s Accident Prevention Advisory Unit which confirmed “the general validity of earlier work by [safety academics] Bird (1969) and Tye and Pearson (1974/75)” on accident ratios, and produced the triangle shown below.
Bird’s work was based in turn on earlier work by Herbert William Heinrich in the 1920s, published and republished from 1932 to 1959 in his book Industrial Accident Prevention: A Scientific Approach
Triangular principles

In the 2nd edition of HSG65 the HSE highlighted three principles based on the accident triangle:
- There are consistently greater numbers of less serious events than more serious ones.
- Many near misses could have become events with more serious consequences.
- All the events (not just those causing injuries) represent failures in control, so are potential learning opportunities.
It is the third conclusion that points towards the value of the triangle as a useful model, and which keeps it on the curriculum of most safety management courses.
When asked why the accident triangle material had been dropped from the new HSG65, the HSE would say only that it had been left out as part of a “shift from primary research sources to focus on available guidance on how to deliver the various aspects of effective health and safety management”.
Criticisms and recommendations
Others have been more forthcoming with their criticisms of Heinrich. In his 2001 book Reviewing Heinrich, US author and consultant Fred Manuele notes that one premise of the triangle model is that reducing accident frequency will equivalently reduce severe injuries, but that “misdirection has resulted from applying … his premises”.
In their book Risk Led Safety, Evidence Driven Management Duncan Spencer and Chris Jerman of the John Lewis retail group are unequivocal: “The Heinrich ratios and associated work by others are misleading and scientifically disproved theories. Let’s stop using them!”
Others love and cherish the model. Elias Al Inaty, Health and Safety Manager for the construction company MAN Enterprise has built his own pyramids, specific to activities in his organisation, based on incidents and observations. “As we aim at continuous improvement, a target number of observations is set for each and every activity. Based on Birds theory, an increase in the number of near misses implies that we will have a serious incident.” Al Inaty refers to this as his “risk speedometer.” “The risk speedometer is a straightforward way of communicating to all relevant parties.”
Numbers and illusions
The most basic criticism of Heinrich’s ratios attacks his data. If his sources were insurance claims, asks Manuele, where did he get such accurate figures on near misses? No one since has been able to verify his data.
Heinrich’s statements were definitive: “Analysis proves that … from data now available … it is estimated that in a unit group of 330 accidents, 300 result in no injuries, 29 in minor injuries and one in a major or lost time case.”
In HSG65 Inset 1 (1997), the HSE used its own accident prevention department’s ratio to illustrate the triangle: 189 non-injury accidents for every seven minor injuries for one major injury (see Figure 1 above). Bird and others suggested different ones. Some have used these variations to dismiss the usefulness of the ratios. But Dr Linda Bellamy’s research (see below) suggests there are different ratios for different types of hazard and you will get different results depending on which organisation, industry or even in which country you have conducted your study.
It is likely the ratios will change over time. But the important points in Inset 1 were not that the numbers formed a golden rule, but that “there are consistently greater numbers of less serious events compared to more serious ones” and that “all the events … are potential learning opportunities”.
There is probably insufficient data to make drawing up a triangle for your own organisation a worthwhile exercise, but looking at those that have access to larger data sets shows that the patterns are there, and it is worthwhile understanding your own incidents.
In support of their dismissal of ratios, Spencer and Jerman cite the Baker report on the BP Texas City Oil Refinery explosion in 2005. The report finds there is little relationship between everyday near misses and the circumstances that result in a major process disaster.
“BP mistakenly interpreted improving personal injury rates as an indication of acceptable process safety performance at its US refineries,” says the report. “BP’s reliance on this data, combined with an inadequate process safety understanding, created a false sense of confidence that BP was properly addressing process safety risks.”
This was not a case that the accident ratio theory was wrong; rather, BP’s managers used something they did understand — slips and trips, for example — as a substitute for something they did not understand.
The US Chemical Safety Board (CSB), which pressed BP to commission the Baker report, did not see this as reason to abandon the triangle and investigation of minor incidents at the base. In 2010, CSB chairman John Bresland said: “Only the highest commitment to running down the even smallest of problems and upsets will assure the prevention of so called low probability, high consequence events like the tragedy that took so many lives in Texas City.”
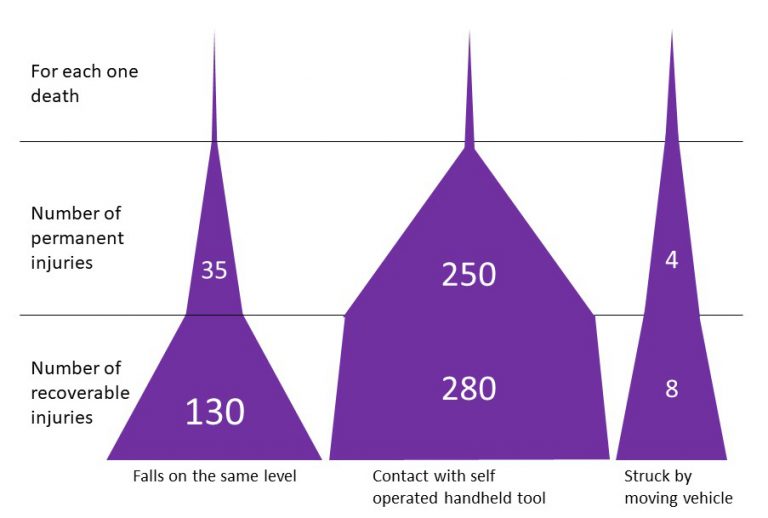
Accident type specific triangles
Created using the data from Dr Linda Bellamy’s 2015 Safety Science paper
Pick and choose
That the conditions leading to a given major process disaster do not relate to slips and trips or your workplace transport accidents does not mean there is nothing to learn from minor accidents and near misses.
People failing to clear up or report slip hazards could indicate you have a safety culture where people also fail to report machine leaks, out of range readings and process anomalies. Identifying that one factor in a near miss between a vehicle and an employee was that the pedestrian missed the part of the induction training that explained walking routes should lead to checks on how critical learning points in the induction training are reinforced and tested.
In his criticisms, Manuele highlights how Heinrich changed his emphasis from 1932. He cites Heinrich saying in the first edition of Industrial Accident Prevention “for every mishap resulting in an injury there are many other accidents in industry which cause no injuries whatsoever,” but points out that by the second edition this has changed to “for every mishap resulting in an injury there are many other similar accidents…”
Manuele sees this change as a sign of Heinrich’s flakiness, but this refinement in how to apply the triangle could have been born out of experience in seeing how industry had misapplied the ratios in the intervening years. The word “similar” is important, as the BP Texas City example shows.
A recent study in the Netherlands, reported in the journal Safety Science, illustrates the importance of considering “similar” accidents. Using a database of 23,000 Dutch occupational accidents between 1998 and 2009, Dr Linda Bellamy compared in detail the circumstances of accidents leading to recoverable injury — those where the casualty attends hospital but suffers no permanent harm, accidents leading to permanent disablement, and those leading to fatalities. This gives a more accurate picture of the shape of the triangle, albeit it leaves out the bottom layer of inconsistently reported near misses.
Bellamy found the triangles were different shapes for different hazards (and not perfect triangles). For every death from being struck by a moving vehicle, for example, she found only four permanent injuries and just eight recoverable injuries — few opportunities, therefore, to learn where improvements need to be made.
By contrast, for every one death from “contact with handheld tool operated by self” there were 280 recoverable injuries. Importantly, within each hazard category, though factors were weighted differently according to the severity of the accident, most factors that were present in the major accidents had been present in the minor ones.
Bellamy concludes: “Investigating the underlying causes of the more minor, more frequent incidents or deviations and fixing the safety barrier problems with a higher severity potential could help prevent the bigger accidents of the same hazard type.”
Learning from experience
The link between frequent minor incidents and infrequent major ones is supported by the many stories in this magazine of HSE prosecutions where there was evidence in advance that something could have been done.
On 5 February 2010 a bale of insulation fell through a suspended ceiling at a church where two men were insulating the roof space. No one was hurt. The men used a harness they had extended with a nylon rope from a DIY shop. On 12 February one of the pair, a volunteer named Lee Bourn, fell through the ceiling and died. The religious charity involved had received a prohibition notice in 2001 after a non-fatal fall from a roof, further evidence it could have prevented the 2010 death if it had learned from experience.
The report into the 1999 Ladbroke Grove train crash said the crash might have been avoided and 31 lives saved “if management had applied the lessons of past SPADs [signal passed at danger], and if signallers had been adequately instructed and trained in how to react to a SPAD”.
If London Underground had given more attention to the “smoulderings” that preceded the 1987 Kings Cross fire, a further 31 lives might have been saved.
What is important is not to apply the accident ratios without intelligence. To assume that if you have reduced the number of mispicks, blocked fire exits or uncleared spillages you have dealt with the high severity hazards is missing the point made in Inset 1 in the old HSG65: “All the events … are therefore potential learning opportunities.”
But you need to consider carefully, as Bellamy has in her research, the factors surrounding the minor accidents or near misses. Ask whether the lack of a fatality or permanent injury after an incident was because of stable controls, or just chance.
If the overnight scaffolding collapse was during weather that would have stopped work anyway, then, as long as you are confident that control will be applied, there may be no need for further action; if the scaffolding collapsed overnight but could equally have happened during the day when people were working on and under it, there is a problem that needs fixing.
The accident triangle also serves as a tool to support organisational memory. Chemical safety expert Trevor Kletz spent his working life reminding people that too many industrial accidents are caused by factors that organisations knew about, understood and forgot. If more than a decade passes between fatal accidents, the turnover of people will be such that individuals will have forgotten why the separate (longer) route for pedestrians was put in place, or why we do not store bricks on the scaffolding, or why contractor and client are required to look at the asbestos register together.
The near miss and minor incident analysis reminds us why these controls are there. If someone had been walking across the loading bay when the lorry backed up too far and damaged some pallets, if they had been walking under the scaffolding when the pile of bricks fell, or if the contractor had not noticed the asbestos sticker on the gasket, the result could have been much worse.
If managers just say, “well, the controls worked this time, no one was hurt”, they allow the dilution of the barriers designed to prevent the serious outcome, increasing the likelihood of such an event.
Taking the temperature
We shouldn’t believe there is a magic ratio that can be applied to all hazards; that if we count the near misses, we can work out the probability of a fatality.
Neither should we assume reducing reported near misses has automatically reduced the likelihood of a fatal accident. If you had a thermometer, would you think that you could change the temperature of the room by pushing the mercury up or down with a needle? Of course not, but if you had changed the temperature of the room, you would expect the mercury to move.
So do not expect to change the likelihood of a major accident by tinkering with the number of near misses or minor injuries. But if you use the minor incidents as potential learning opportunities they can reveal changes that could have a positive effect on the serious events.
Many health and safety practitioners still refer to ratios as an educational tool to get buy in from management to the idea of leading indicators, and to explain to staff the importance of reporting.
Ray Jeffery, group health, safety and environment manager at the Building Research Establishment, uses the triangle in this way, admitting: “I know there is no science behind the numbers, but it does paint a good picture to explain why near miss reporting is an important proactive measure which can prevent something going wrong if acted on.”